[ad_1]
The star-studded Los Angeles Dodgers were expected to emerge as the most powerful team in the big leagues this year, and they haven’t disappointed.
The Dodgers didn’t boast the best win-loss record after seven weeks of play, a period that ended on May 15. The Philadelphia Phillies held that distinction with an imposing 31-13 mark.
But Los Angeles (29-16) did top the majors in overall base value (OBV), a key measure of offensive and defensive efficiency.
Teams are credited with positive base values in either of these instances:
-
Their batters reached more bases than average-level big leaguers would have attained under identical circumstances.
-
Their pitchers surrendered fewer bases than their typical counterparts would have yielded in the same conditions.
The Dodgers amassed an OBV of plus-241 in just seven weeks of play. How impressive is that total? Consider this: Only 10 of the 30 major-league clubs surpassed 241 in the entire 2023 season. (The Atlanta Braves were last year’s leaders with an OBV of plus-680.)
Both sides of the roster, as you would expect, have contributed to the Dodgers’ success so far. Their hitters reached 144 more bases than normal, while the pitchers yielded 97 fewer than the major-league average.
Philadelphia is second in the seven-week OBV rankings at plus-198, and the Baltimore Orioles are third. Here is the top 10:
-
1. Los Angeles Dodgers, OBV +241
-
2. Philadelphia Phillies, OBV +198
-
3. Baltimore Orioles, OBV +144
-
4. Boston Red Sox, OBV +135
-
5. New York Yankees, OBV +128
-
6. Atlanta Braves, OBV +119
-
7. Milwaukee Brewers, OBV +112
-
8. Seattle Mariners, OBV +73
-
9. Detroit Tigers, OBV +52
-
10. Chicago Cubs, OBV +39
Precisely half of all big-league clubs — 15 of 30 — posted positive OBVs after seven weeks. That means, of course, that the other half were underwater.
The very worst are the Miami Marlins, whose batters reached 147 fewer bases than normal and whose pitchers surrendered 117 more than average. Their resulting OBV? A pathetic minus-264. (Only five clubs fared worse in the entirety of 2023, with the Colorado Rockies’ minus-773 at the very bottom.)
It’s no surprise that Miami’s winning percentage of .289 (13-32) was also the worst on the morning of May 16.
Here are the 10 worst laggards in overall base value:
-
1. Miami Marlins, OBV -264
-
2. Chicago White Sox, OBV -207
-
3. Colorado Rockies, OBV -129
-
3. Toronto Blue Jays, OBV -129
-
5. San Francisco Giants, OBV -126
-
6. St. Louis Cardinals, OBV -106
-
7. Pittsburgh Pirates, OBV -92
-
8. Oakland Athletics, OBV -67
-
9. Tampa Bay Rays, OBV -55
-
10. New York Mets, OBV -50
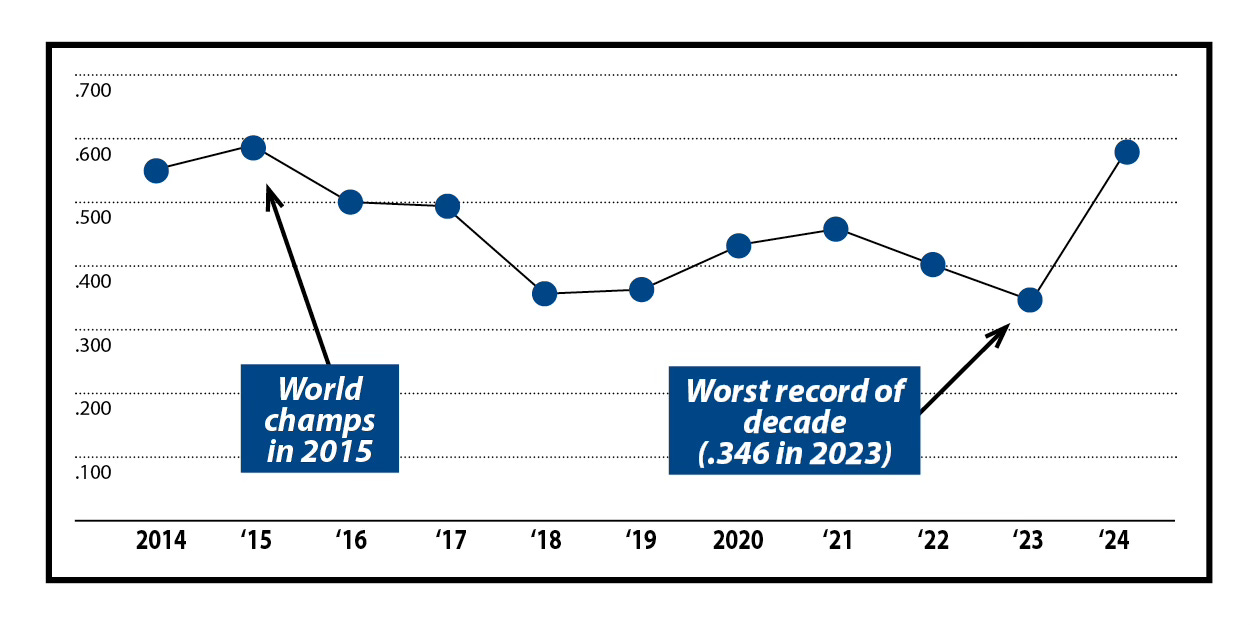
Less than a decade has elapsed since the Kansas City Royals won the 2015 World Series, but the distance seems much greater.
The Royals have generally been a sub-.500 club — sometimes very sub — since the turn of the century. The only exceptions have been a brief .512 blip in 2003 and the 2013-2016 span that encompassed two World Series appearances and that 2015 championship.
The franchise, as you can see on the graph, returned to form by dipping slightly below .500 in 2017. It has remained there ever since.
Until this year. The Royals blended young talent (notably Bobby Witt Jr.) with useful free agents (primarily Seth Lugo) to stand seven games above .500 at the seven-week mark of the current season.
Kansas City’s .578 winning percentage in 2024 is better than all but one of its year-ending records over the past decade. The only year that went better, of course, was 2015.
A new installment will arrive in your email each Tuesday morning
Most of my quizzes encompass a wide range of players from both leagues. But I’ve decided to make an exception this week, focusing solely on the Dodgers.
And not only that, I’m dealing solely with the Los Angeles Dodgers. Forget about their Brooklyn incarnation. The following questions are concerned only with the period since the club relocated to L.A. in 1958.
You’ll find the answers at the very bottom of this newsletter.
1. Which player hit the most career homers as a member of the Los Angeles Dodgers?
2. Which Dodger (since 1958) hit the most home runs in a single season?
-
A. Steve Garvey
-
B. Shawn Green
-
C. Eric Karros
-
D. Mike Piazza
3. Who stole the most bases in an L.A. Dodgers uniform?
4. Which pitcher secured the most wins for the Dodgers after the franchise moved to California?
5. Which pitcher racked up the most strikeouts in his L.A. career?
-
A. Don Drysdale
-
B. Clayton Kershaw
-
C. Sandy Koufax
-
D. Don Sutton
There is perhaps no greater sign of respect than the intentional walk.
If first base is open, why face a dangerous hitter with the game on the line? That’s a question opposing managers often ask themselves when Freddie Freeman, Bryce Harper, or others of their ilk stroll to the batter’s box.
What do those managers decide? They frequently ask the home-plate umpire to motion a threatening slugger directly to first. Freeman tops all active players with 129 intentional walks over his career, followed by Harper with 125 and two other batters above 100.
Here are the 10 leading recipients of intentional passes among current players, according to Baseball Reference’s career tabulations through the first seven weeks of 2024:
-
1. Freddie Freeman, IBB 129
-
2. Bryce Harper, IBB 125
-
3. Mike Trout, IBB 120
-
4. Paul Goldschmidt, IBB 115
-
5. Giancarlo Stanton, IBB 86
-
6. Jose Ramirez, IBB 78
-
7. Brandon Crawford, IBB 75
-
7. Anthony Rizzo, IBB 75
-
9. Nolan Arenado, IBB 74
-
10. Andrew McCutchen, IBB 69
The Tigers enjoyed a perfect week during the span from May 14 to May 20, 1984.
Detroit began by sweeping a three-game series against the Seattle Mariners by a collective score of 23-10. The Tigers followed up with three straight victories over Oakland, taking the final two games by one-run margins.
Pitchers Jack Morris and Milt Wilcox each notched two wins during the week. Morris’s stats for 1984 (as of May 21) were 8-1 with a 2.19 ERA. Wilcox’s marks were 6-0 and 3.08.
The ’84 Tigers — who rank as the greatest team of baseball’s Modern Era (1961 to the present) — boasted an amazing record of 32-5 (with a winning percentage of .865) on the morning of May 21.
The Toronto Blue Jays had run up an impressive .632 record themselves, which would have landed them atop any of the other three big-league divisions. Yet they found themselves in second place in the American League East, 8.5 games behind the Tigers.
The 1962 New York Mets were destined to be remembered as the losingest team of the Modern Era. But they did almost nothing but win between May 14 and May 20.
The week began with a pair of walk-off victories over the Chicago Cubs by identical scores of 6-5. Pinch-hitter Hobie Landrith drew a bases-loaded walk to force home the winning run in the 13th inning on May 15. Third baseman Felix Mantilla came through with a decisive single in the 11th inning of the next afternoon’s game.
The Mets rode their momentum into Milwaukee, where they took three of four games from the Braves. New York’s 12-19 record elevated it to eighth place in the National League, ahead of the Cubs and the Houston Colt .45s.
1-C. (Karros launched 270 homers for the Dodgers between 1991 and 2002. The franchise’s career runner-up, who was not listed as a choice above, is Ron Cey at 228.)
2-B. (Green hit 49 homers for the Dodgers in 2001. Adrian Beltre, not listed as a choice, comes next with 48 in 2004.)
3-D. (Wills is the leader on a single-season basis with 104 steals in 1962 — and for an entire career with 490 between 1959 and 1972.)
4-D. (Sutton tops the rankings with 233 wins for the Dodgers in a span from 1966 to 1980, coupled with a final bow in 1988. Kershaw is the only other L.A. pitcher above 200. He had 210 career wins through the first seven weeks of 2024.)
5-B. (Kershaw’s current total of 2,944 is easily the best in the franchise rankings, with Sutton the runner-up at 2,696.)
[ad_2]
Source link


