[ad_1]
The baseball season has dwindled to its final month, and there’s a minimal amount of suspense.
The Baltimore Orioles and New York Yankees appear likely to battle for the American League East title all the way to the end, the AL Central race is tantalizingly tight, and that’s about it. The other divisions seem to be (nearly) settled, and the wild-card races aren’t all that close.
And yet, you never know.
It’s possible for a team to suddenly get hot — really hot — in the last month of the season. The primary example comes from 2017, when Cleveland’s AL club, then known as the Indians, ran off a 22-game winning streak between the final week of August and the middle of the following month.
The Indians already held a 4.5-game lead in the AL Central when the streak began, a margin they expanded to 13.5 games by mid-September. Their overall record for the final month was 26-4, and their winning percentage of .867 remains the highest for any club in the Modern Era (1961 to the present) after the end of August.
Listed below are the 10 clubs with the best records in September (and early October, if the schedule ran that long) since ‘61. Each is listed with its wins, losses, and winning percentage through the end of August, followed by the same stats for the period after that.
All 10 of these clubs qualified for the playoffs, including three that were outside the postseason picture as of September 1 (the 1974 Orioles, 1995 Yankees, and 2013 Indians). But none of the 10 went on to win its league pennant. So much for the theory of momentum.
-
1. Indians 2017 (through August: 76-56, .576; after: 26-4, .867)
-
2. Athletics 2001 (through August: 79-56, .585; after: 23-4, .852)
-
3. Royals 1977 (through August: 76-54, .585; after: 26-6, .813)
-
4. Orioles 1974 (through August: 66-65, .504; after: 25-6, .806)
-
5. White Sox 1983 (through August: 75-57, .568; after: 24-6, .800)
-
6. Mets 1988 (through August: 78-54, .591; after: 22-6, .786)
-
6. Yankees 1995 (through August: 57-59, .491; after: 22-6, .786)
-
8. Cardinals 2002 (through August: 76-59, .563; after: 21-6, .778)
-
8. Indians 2013 (through August: 71-64, .526; after: 21-6, .778)
-
8. Astros 2018 (through August: 82-53, .607; after: 21-6, .778)
You knew it was coming. The following list is the flip side of the one above, showing the 10 Modern Era teams that ran up the worst records after the end of August.
The 2002 Baltimore Orioles top the list. They played respectably well through the end of August — not great, but reasonably close to .500 with a 63-71 record. That’s when the wheels came off.
The Orioles lost 24 of their final 28 games, including the last 12 on their schedule. Baltimore had been third in the American League East at the beginning of the final month, but it finished fourth, 36.5 games out of first. Only the horrendous play of the Tampa Bay Devil Rays (48 games out) kept them from finishing last.
Here are the 10 weakest stretch drives since 1961:
-
1. Orioles 2002 (through August: 63-71, .470; after: 4-24, .143)
-
2. Blue Jays 1978 (through August: 55-80, .407; after: 4-22, .154)
-
2. Tigers 1996 (through August: 49-87, .360; after: 4-22, .154)
-
4. Rangers 1972 (through August: 49-76, .392; after: 5-24, .172)
-
5. Pirates 1998 (through August: 64-71, .474; after: 5-22, .185)
-
6. Tigers 1975 (through August: 52-81, .391; after: 5-21, .192)
-
6. Tigers 2002 (through August: 50-85, .370; after: 5-21, .192)
-
6. Giants 2018 (through August: 68-68, .500; after: 5-21, .192)
-
9. Orioles 2008 (through August: 63-73, .463; after: 5-20, .200)
-
9. Tigers 2017 (through August: 58-74, .439; after: 6-24, .200)
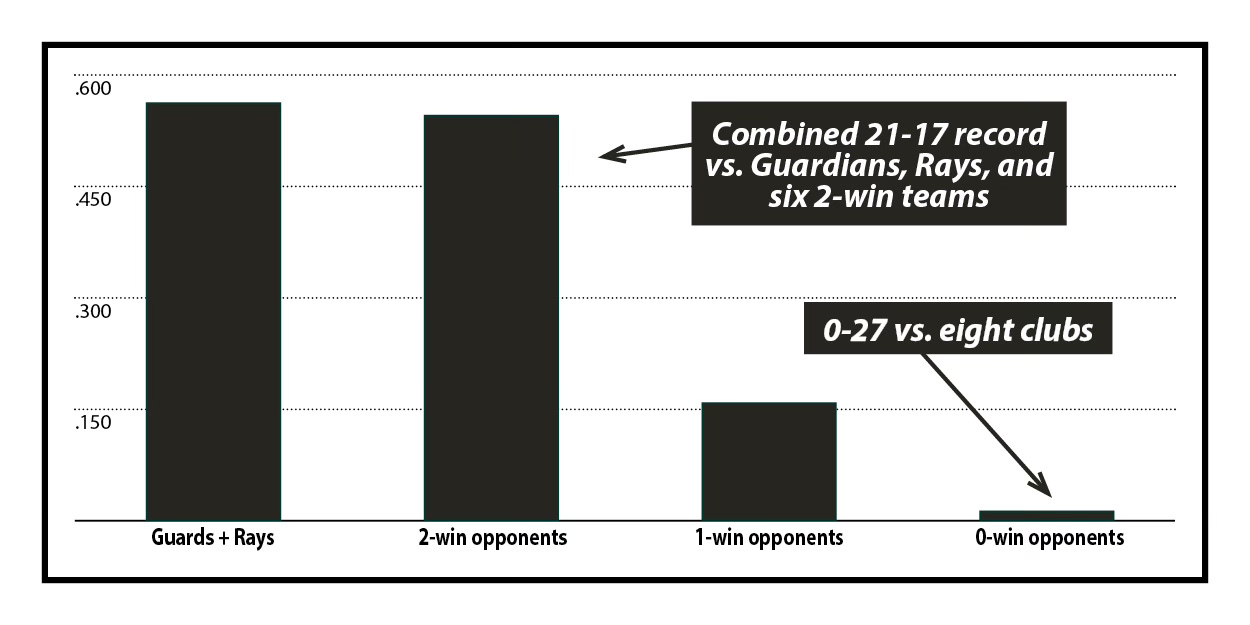
I’ve got the solution to the woes besetting the Chicago White Sox. They should play only the Cleveland Guardians and Tampa Bay Rays. Nobody else.
Chicago had gone 5-5 against the Guardians and 4-2 versus the Rays when the current season hit the 21-week milestone on August 22. That’s a combined record of 9-7 for a winning percentage of .563. Pretty good.
The Sox had won two games apiece from a half-dozen clubs at that point: the Astros, Braves, Cardinals, Nationals, Red Sox, and Rockies. Their record against those six teams was 12-10 (.545).
The rest of the news is discouraging, as you’d expect from a club that shot past 100 defeats before the end of August. The White Sox had a single win this year against each of 10 teams, including identical 1-12 marks against two divisional foes, the Royals and Twins. Chicago’s combined record against these 10 clubs was 10-53 (.159).
That leaves eight teams that won every single game, leaving the White Sox with a record of 0-27 (.000) against them. (The Sox had not yet faced the Angels, Mets, and Padres after 21 weeks of play.)
Today’s graph breaks down these unhappy stats from a very, very unhappy season:
A new installment will arrive in your email each Tuesday morning
Four active pitchers have worked more than 2,200 innings in their careers. Today’s quiz pits them in five different categories, challenging you to pick the overall leaders through the 21-week mark (August 22) of the 2024 season.
Scroll to the bottom of this newsletter for the answers.
1. Who has the most career wins?
2. Whose career ERA is the best?
-
A. Johnny Cueto
-
B. Clayton Kershaw
-
C. Max Scherzer
-
D. Justin Verlander
3. Who has accumulated the most strikeouts?
-
A. Johnny Cueto
-
B. Clayton Kershaw
-
C. Max Scherzer
-
D. Justin Verlander
4. Who has worked the most complete games?
-
A. Johnny Cueto
-
B. Clayton Kershaw
-
C. Max Scherzer
-
D. Justin Verlander
5. Who has hit the most batters?
-
A. Johnny Cueto
-
B. Clayton Kershaw
-
C. Max Scherzer
-
D. Justin Verlander
Shohei Ohtani, the superstar designated hitter for the Los Angeles Dodgers, is on track for an unprecedented 50-50 season.
Atlanta’s Ronald Acuna Jr. came closest to 50-50 when he bashed 41 home runs and stole 73 bases in 2023, an amazing demonstration of power and speed. But he still fell nine homers short of 50 in that category.
It remains to be seen if Ohtani can reach both standards, though he has shown an ability to quickly add numbers on each side of the ledger. He had eight games (in the first 21 weeks) this year in which he hit at least one home run and stole one or more bases.
Elly De La Cruz of the Cincinnati Reds and Francisco Lindor of the New York Mets are the runners-up with six HR/SB games apiece. A total of eight players have had four or more of these double-threat performances in 2024. Here, with thanks to Baseball Reference, is the list:
-
1. Shohei Ohtani, Dodgers, 8 games
-
2. Elly De La Cruz, Reds, 6 games
-
2. Francisco Lindor, Mets, 6 games
-
4. Luis Garcia Jr., Nationals, 5 games
-
4. Gunnar Henderson, Orioles, 5 games
-
6. Jazz Chisholm Jr., Marlins-Yankees, 4 games
-
6. Jarren Duran, Red Sox, 4 games
-
6. Spencer Steer, Reds, 4 games
The Detroit Tigers took their foot off the gas during the week of August 27 to September 2, 1984.
The pennant race in the American League East, for all intents and purposes, was over. The ’84 Tigers (who rank as the best team of baseball’s Modern Era) began the week with a 12-game lead over the second-place Toronto Blue Jays.
Detroit bookended the seven-day period with wins over the Seattle Mariners and Oakland Athletics, but lost the four games in between. The most heartbreaking defeat was a 13-inning loss to the A’s, 7-6, on August 31. Mike Davis scored the winning run for Oakland on a wild pitch by Dave Rozema.
The Tigers still had an impressive 88-49 record on the morning of September 3, though their lead over Toronto had slipped to 8.5 games.
The week of August 27 to September 2, 1962, started very nicely for the New York Mets, who were destined to suffer 120 defeats that year.
Pitcher Al Jackson tossed a three-hit shutout against the Philadelphia Phillies on August 28, winning 2-0. It was Jackson’s seventh victory of the season (against 17 defeats).
But the Phillies won the remaining three games of their series, and the Mets then dropped a pair to the St. Louis Cardinals. The week ended with another rare victory, 4-3 over the Cards on September 2. Jackson was the winning pitcher again.
Their loss to Philadelphia on August 29th was the 100th of the year for the Mets. They ended the week with a 35-103 record, deep in last place in the National League, 55.5 games behind the frontrunning Los Angeles Dodgers.
1-D. (Verlander holds a substantial lead over the field. His 260 career wins are 44 ahead of runner-up Scherzer’s 216.)
2-B. (It’s Kershaw by a mile. His career ERA is 2.48, followed by Scherzer at 3.16.)
3-C. (Scherzer has 3,405 strikeouts, just six ahead of Verlander’s 3,399. The other two are far back.)
4-D. (Verlander has 26 complete games to his credit, edging ahead of Kershaw’s 25.)
5-A. (Cueto has pitched the fewest innings among the foursome, yet he has piled up the most HBPs, 120 in all. Verlander is next with 113 hit batters.)
[ad_2]
Source link


