 outfielders, strikeout inflation, and the top triplers")
[ad_1]
Last week’s newsletter featured a position-by-position breakdown of the best infielders during the first half of the 2024 season. (Well, roughly the first half. I used the traditional July 4 cutoff, which isn’t exactly 50-50, but close enough.)
Today’s story is about baseball’s top outfielders, based on the same measure (overall base value) and the same window (all games through Independence Day). The rankings are limited to batters who made at least 150 plate appearances and played at least 50 percent of their games at the designated position.
Overall base value is a comparison of a hitter’s output and the major-league average. A positive OBV indicates that a batter reached more bases (through singles, doubles, triples, home runs, walks, stolen bases, hit batters, and sacrifices) that his typical counterpart would have attained under identical circumstances.
Let’s use one of the top-rated outfielders, Juan Soto of the New York Yankees, as an example. He piled up 252 bases and made 222 outs through July 4. The average big-league hitter would have accumulated 148 bases with the same number of outs. Soto’s base total is 104 above that, which is why his OBV is plus-104.
Below are lists of the top five players at each outfield position in each league. The American League leaders (from left field to right) are Jarren Duran, Aaron Judge, and Soto. The National Leaguers are Christian Yelich, Heliot Ramos, and Fernando Tatis Jr.
-
1. Jarren Duran, Red Sox, OBV 60
-
2. Riley Greene, Tigers, OBV 50
-
3. Steven Kwan, Guardians, OBV 46
-
4. Tyler O’Neill, Red Sox, OBV 36
-
5. Taylor Ward, Angels, OBV 15
-
1. Christian Yelich, Brewers, OBV 65
-
2. Jurickson Profar, Padres, OBV 51
-
3. Brandon Nimmo, Mets, OBV 45
-
4. Jesse Winker, Nationals, OBV 35
-
5. Bryan Reynolds, Pirates, OBV 31
-
1. Aaron Judge, Yankees, OBV 142
-
2. Kevin Pillar, White Sox-Angels, OBV 24
-
3. Byron Buxton, Twins, OBV 15
-
4. JJ Bleday, Athletics, OBV 9
-
5. Jake Meyers, Astros, OBV 6
-
1. Heliot Ramos, Giants, OBV 34
-
2. Brenton Doyle, Rockies, OBV 27
-
3. Jackson Merrill, Padres, OBV 21
-
4. Jazz Chisholm Jr., Marlins, OBV 15
-
5. Cody Bellinger, Cubs, OBV 9
-
1. Juan Soto, Yankees, OBV 104
-
2. Kyle Tucker, Astros, OBV 73
-
3. Anthony Santander, Orioles, OBV 29
-
4. Kerry Carpenter, Tigers, OBV 26
-
5. Wilyer Abreu, Red Sox, OBV 21
-
1. Fernando Tatis Jr., Padres, OBV 34
-
2. Seiya Suzuki, Cubs, OBV 24
-
3. Jake McCarthy, Diamondbacks, OBV 22
-
4. Ronald Acuna Jr., Braves, OBV 15
-
5. Starling Marte, Mets, OBV 12
-
5. Mike Tauchman, Cubs, OBV 12
Here’s the other side of the outfield rankings, consisting of the batters who reached fewer bases than the big-league average through July 4.
The outfielders with the worst OBVs, again from left to right field, are Andrew Benintendi, Mickey Moniak, and Mitch Haniger in the AL, along with Adam Duvall, Michael A. Taylor, and Nick Castellanos in the NL.
The three players with the worst negative numbers are shown for each position.
We looked last week at the trend for walks. Or, should I say, the lack of a trend. The number of walks issued per game hasn’t deviated all that much over the past 100 years.
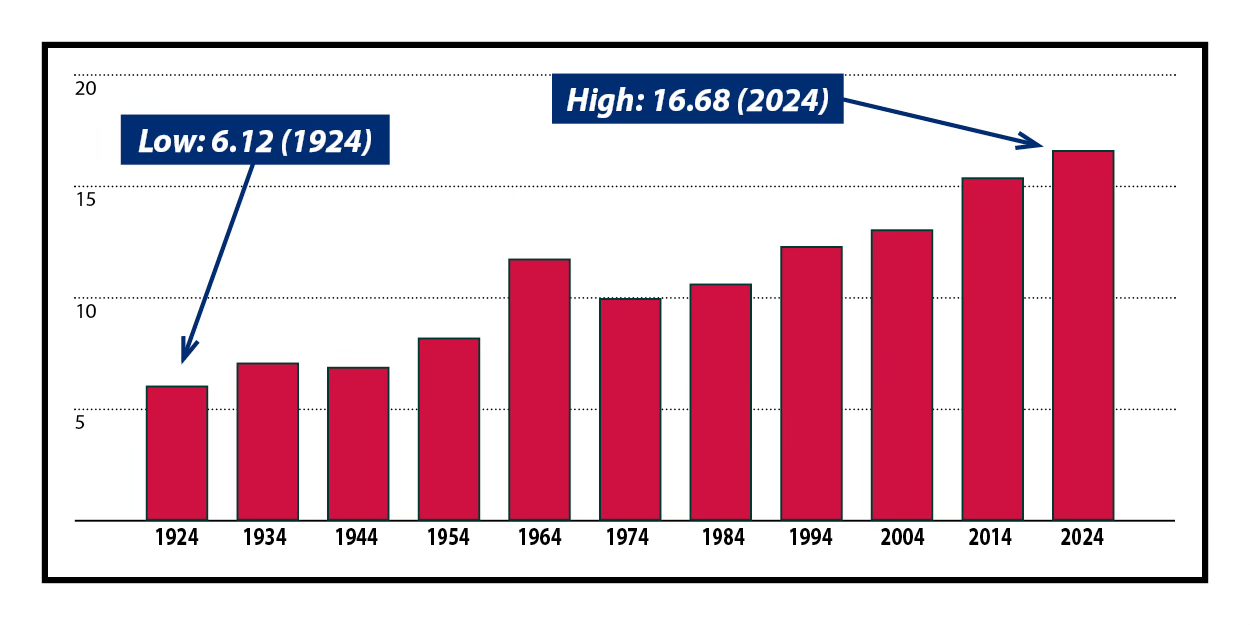
That’s hardly the case for strikeouts, which have been steadily on the rise. The graph below shows the number of strikeouts per game (by both teams) at 10-year intervals since 1924. This year’s pace of 16.68 per game is the highest rate depicted.
But don’t lose hope. If the graph showed every single season — and not just those that end in 4 — we’d see that the SO rate actually peaked at 17.62 per game in 2019. It has dropped by almost a full strikeout since then.
Progress perhaps?
A new installment will arrive in your email each Tuesday morning
This week’s newsletter seems to be following last week’s lead in all the various categories, so why stop here?
July 9’s quiz focused on the teams that led various statistical categories for batters at the halfway point of the season. We turn our attention this week to the team-by-team performances by pitchers. Flip to the bottom of this page for the answers.
1. Which pitching staff has the lowest earned run average?
-
A. Atlanta Braves
-
B. Baltimore Orioles
-
C. Los Angeles Dodgers
-
D. Philadelphia Phillies
2. Which club has issued the fewest walks?
-
A. Boston Red Sox
-
B. Minnesota Twins
-
C. Philadelphia Phillies
-
D. Seattle Mariners
3. Who has recorded the most strikeouts?
-
A. Chicago Cubs
-
B. Minnesota Twins
-
C. Philadelphia Phillies
-
D. San Diego Padres
4. Which staff has registered the most shutouts?
-
A. Atlanta Braves
-
B. Cleveland Guardians
-
C. Los Angeles Dodgers
-
D. Philadelphia Phillies
5. And let’s take a negative spin for the final question. Who has the worst ERA?
-
A. Arizona Diamondbacks
-
B. Chicago White Sox
-
C. Colorado Rockies
-
D. Los Angeles Angels
The triple is an endangered species. It isn’t as close to extinction as the complete game, though it has definitely become a rarity.
The typical game in 2024 has been devoid of triples. The average for both teams is just 0.30 triples per contest. That’s one-seventh of the rate for home runs, which have been occurring at a frequency of 2.16 per game this year.
The Modern Era’s great triplers (is that even a word?) are all retired. Willie Wilson, the speedster who spent most of his 19-year career with the Kansas City Royals, hit 147 careers, the highest total for any major leaguer since 1961.
Here are the 10 batters with the most triples between 1961 and July 4, 2024, according to Baseball Reference:
-
1. Willie Wilson (1976-1994), 147
-
2. Lou Brock (1961-1979), 141
-
3. George Brett (1973-1993), 137
-
3. Willie Davis (1961-1979), 137
-
5. Pete Rose (1963-1986), 135
-
6. Brett Butler (1981-1997), 131
-
6. Jose Reyes (2003-2018), 131
-
8. Robin Yount (1974-1993), 126
-
9. Steve Finley (1989-2007), 124
-
10. Carl Crawford (2002-2016), 123
The 1984 Detroit Tigers would be remembered as the greatest team of baseball’s Modern Era (all seasons since 1961), though they didn’t look the part in early July, stumbling into the All-Star break by losing five of their last seven games. But they turned things around, beginning the second half of the season in better form.
The Tigers took three of four games from the Minnesota Twins from July 12 to 15, giving them an impressive 60-28 record on the morning of July 16. They retained a seven-game lead in the American League East over second-place Toronto. The Blue Jays notched three wins in their four-game set with the Oakland Athletics.
Detroit relief pitcher Willie Hernandez picked up two wins in the Minnesota series, giving him a 6-0 record with 16 saves and a 2.11 earned run average. Columnists were starting to suggest that Hernandez might be a contender for the Cy Young Award if he maintained his pace.
The 1962 New York Mets, the losingest team in the Modern Era, resumed their unhappy ways after the All-Star break.
They swung back into action on July 12 with five home games against the Los Angeles Dodgers and San Francisco Giants. The visitors came away with four victories.
New York’s ugliest defeat came on July 14, when the Dodgers pounded the Mets, 17-3. Los Angeles rapped seven extra-base hits, including homers by such unlikely sluggers as speedster Maury Wills and pitcher Stan Williams. Five Mets pitchers gave up 16 hits and eight walks.
The Dodgers held first place in the National League on the morning of July 16. The Mets were 10th and last, wallowing 34.5 games off the pace.
1-D. (The Phillies had an ERA of 3.17 after the games of July 4, giving them a substantial lead. The Orioles were next at 3.42.)
2-D. (The Mariners yielded 207 walks through Independence Day, followed by the Twins with 219.)
3-D. (The Padres led the majors with 792 strikeouts, edging the Twins’ total of 789.)
4-A. (The Braves had 10 shutouts as of the July 4 holiday, the highest total in the majors. The Dodgers were next with nine.)
5-C. (Denver’s mile-high altitude has certainly hurt the Rockies’ staff, which had a collective ERA of 5.53 ERA as of July 4. The Diamondbacks were next-worst at 4.64.)
[ad_2]
Source link


