
[ad_1]
The New York Yankees edged the Miami Marlins, 3-2, on April 9. The Los Angeles Dodgers wrapped up their 6-3 win over the Minnesota Twins about an hour later.
The two victors thereby became the first teams in their respective leagues to reach double digits in the win column: the American League Yanks at 10-2, the National League Dodgers at 10-4. Recent history suggests that they should start getting ready for the playoffs.
These were the first teams to get to 10 wins in the three previous post-pandemic seasons:
-
2021: AL Boston Red Sox on April 17 (with a 10-4 record), NL Dodgers on April 14 (10-2).
-
2022: AL Toronto Blue Jays on April 23 (10-5), NL New York Mets on April 21 (10-4).
-
2023: AL Tampa Bay Rays on April 10 (10-0), NL Atlanta Braves and Milwaukee Brewers (10-4) on April 14.
The good news first. All seven of these clubs made the playoffs, thereby demonstrating the lasting value of a strong start.
And the bad news? None of them won the World Series. None, in fact, even made it to the World Series.
The Red Sox and Dodgers both lost their league championship series in ’21. The fast starters in the two subsequent seasons didn’t even get that far.
The race, as the old fable tells us, often goes to the slow and steady. That’s something for the Yankees and Dodgers to keep in mind this year.
Patrick Corbin enjoyed a dream season in 2019, his first year in Washington.
The left-hander joined the Nationals as a free agent, signing a six-year, $140 million contract. The deal immediately seemed to be beneficial for both sides, with Corbin producing a 14-7 record and 3.25 ERA in 2019’s regular season, capping it with a gritty victory in Game Seven of the World Series.
Everything has gone sour since then. Corbin’s combined record for 2020-2023 was 27-57 with a 5.62 ERA. And 2024 has started on the same unhappy foot, with Corbin losing two of his first three starts, surrendering 15 earned runs in just 16 innings.
Everybody involved — Corbin, the Nats, their fans — seems to be confused by this historic decline, and I do mean historic.
Corbin lost at least 15 games and posted an ERA higher than 5.00 in each of the past three seasons. Nobody else has suffered such threefold misery in the entire history of big-league ball.
Twenty-six pitchers have endured two seasons with 15-plus losses and a 5.00-plus ERA, dating back to the renowned Egyptian Healy in 1887 and 1889. (You remember Healy, right?) The sole active pitcher in the club — well, sort of active — is Zack Greinke, who has not yet announced his retirement. He crossed the two unhappy milestones in 2005 and again last year.
The only good news for Corbin is that Early Wynn is also on the list. He suffered 16 losses with a 5.12 ERA in 1942, then went 19 and 5.82 in 1948.
And what happened to Wynn after that? You can find out by reading his plaque in the National Baseball Hall of Fame.
Home-field advantage is a real thing, though its impact varies by club and by year.
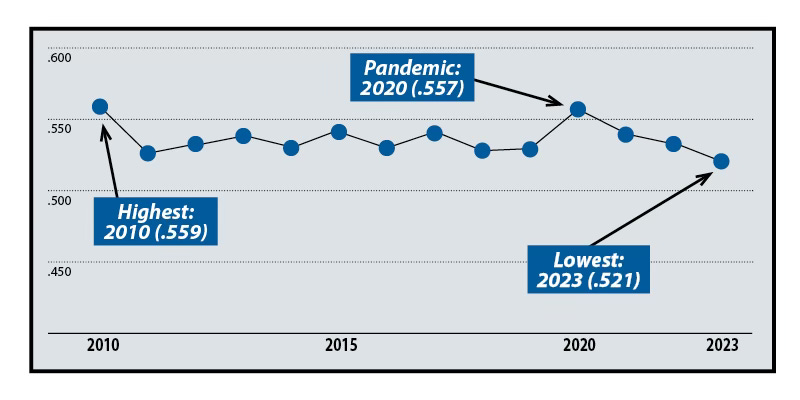
Home teams have posted a combined winning percentage of .535 in the 14 major-league seasons since 2010. That means an average team will be victorious in 43.3 of its 81 home games over the course of a given year, yielding a rounded record of 43-38, five games above .500.
The problem (of course) is that the same average club, by definition, will go 38-43 on the road, putting its final record at a dead-even 81-81.
Every team enjoys a home-field advantage, the Colorado Rockies most of all. The Rockies have played respectable ball in Coors Field since 2010, with a 14-year winning rate of .524. But they’ve stumbled to a .380 record on the road, 144 percentage points worse than their home record.
The Philadelphia Phillies and Pittsburgh Pirates come next on the list with home-field advantages of 103 and 99 percentage points. The team that derives the smallest benefit from its own ballpark is the Boston Red Sox, who carry an advantage of just 27 percentage points in Fenway Park.
The winning rate for home teams does tend to fluctuate, as shown by the graph below. The strongest disparity was evident in the first season of the study period, 2010, when the home percentage was .559. The weakest was the most recent year, with clubs going .521 at home.
A new installment will arrive in your email each Tuesday morning
We’re not quite three weeks into the 2024 season, much too early to draw any inferences from the new statistics being accumulated around the major leagues.
It makes better sense to examine the full body of work from 2023 to sort out the teams with offensive strengths and those with glaring deficiencies, which just happens to be the focus of this week’s quiz.
You can, as always, scroll down to the bottom of this newsletter for the answers.
1. Which team pounded the most home runs last season?
-
A. Atlanta Braves
-
B. Los Angeles Dodgers
-
C. New York Yankees
-
D. Texas Rangers
2. And which ballclub hit the fewest homers?
-
A. Cleveland Guardians
-
B. Kansas City Royals
-
C. Pittsburgh Pirates
-
D. Washington Nationals
3. Which team coaxed the most walks from opposing pitchers?
-
A. Los Angeles Dodgers
-
B. Milwaukee Brewers
-
C. Minnesota Twins
-
D. San Diego Padres
4. Which club suffered the most strikeouts?
-
A. Chicago White Sox
-
B. Colorado Rockies
-
C. Minnesota Twins
-
D. Seattle Mariners
5. Which team left the most men on base?
-
A. Chicago Cubs
-
B. Houston Astros
-
C. St. Louis Cardinals
-
D. San Francisco Giants
Twenty-two major-league pitchers have amassed more than 2,000 strikeouts since we flipped centuries in the year 2000. (A few of you, I know, are purists who contend that the 21st century began in 2001. Well, forget that. I’m siding with the 2000-leaning majority in this controversy.)
At the top of the list — the strikeout king of our current century — is Max Scherzer, who has notched 3,367 strikeouts since tossing his first pitch for the Arizona Diamondbacks in 2008. Just 25 K’s behind him is Justin Verlander, who reached the majors in 2005. Both are still active.
Below are the 10 pitchers who have recorded the most strikeouts in the 21st century, as determined by Baseball Reference:
-
1. Max Scherzer (2008-2023), SO 3,367
-
2. Justin Verlander (2005-2023), SO 3,342
-
3. CC Sabathia (2001-2019), SO 3,093
-
4. Zack Greinke (2004-2023), SO 2,979
-
5. Clayton Kershaw (2008-2023), SO 2,944
-
6. Cole Hamels (2006-2020), SO 2,560
-
7. Felix Hernandez (2005-2019), SO 2,524
-
8. Jon Lester (2006-2021), SO 2,488
-
9. A.J. Burnett (2000-2015), SO 2,480
-
10. John Lackey (2002-2017), SO 2,294
Precipitation was a major factor for the Tigers on this week 40 years ago. A pair of Detroit’s games in Boston (April 15 and 16, 1984) were rained out and rescheduled for August.
That left only three games to be played between April 10 and 16, and the ‘84 Tigers (who rank as the best big-league team since 1961) emerged as the winners of all three. They packed 51,238 into Tiger Stadium for their home opener on the 10th, which they won easily (5-1) over the Texas Rangers. Their other two victories were high-scoring affairs: 9-4 against Texas (with pitcher Jack Morris nabbing his third win of the year) and 13-9 against the Red Sox.
Detroit’s 8-0 record on the morning of April 16, 1984, gave the Tigers a three-game lead over the second-place Toronto Blue Jays in the American League East.
The New York Mets began their journey to ignominy on April 11, 1962, the first game in the franchise’s history.
The final score in St. Louis: Cardinals 11, Mets 4. It was destined to be the first of New York’s 120 defeats, the largest number of losses suffered by any club in the Modern Era (1961-present).
Starting pitcher Roger Craig lasted only three innings for New York, allowing five runs on eight hits. He would lose a second game to the Pirates before the week was out.
The Mets returned to New York’s decrepit Polo Grounds after their one-game Midwestern visit. Only 12,447 fans attended the home opener, which Pittsburgh won 4-3. The Pirates took the next two games too, leaving the Mets with an 0-4 record. But that (technically) didn’t put them in last place in the National League as of April 16, an unhappy distinction that belonged to the 0-5 Chicago Cubs.
1-A. (The Braves easily outdistanced the field. They launched 307 homers last season. No other club had more than 249.)
2-A. (The Guardians hit only 124 home runs in 162 games in 2023.)
3-D. (The Padres drew 653 walks, translating to an average of slightly more than four per game. The Dodgers were close behind with 644.)
4-C. (The free-swinging Twins topped the majors with 1,654 strikeouts, equaling an average of 10.2 per game.)
5-C. (The Cardinals allowed more baserunners to go to waste than any other team. They left 1,183 men on base last season.)
[ad_2]
Source link


