[ad_1]
The San Diego Padres have surprised the pundits this year. The Padres decisively reduced their payroll at the beginning of 2024 — and supposedly lowered their expectations accordingly.
The latter deduction was incorrect. San Diego is very much in the hunt for a playoff berth, perhaps even the National League West title.
One reason is the club’s skill at the plate. The Padres led the majors in a couple of key categories as of mid-August.
The first of those stats is closely monitored (if disparaged by some analysts). San Diego’s team batting average of .267 is five points better than the .262 for the runner-up in that category, the Boston Red Sox.
The second is hardly watched at all, but may be even more important. The Padres have the highest contact rate (CT) in the majors: .805.
CT is simply the percentage of at-bats that don’t end in strikeouts. San Diego’s .805 indicates that its hitters put the ball in play 80.5 percent of the time. And when the ball is in play, good things can happen.
Below is the list of the 10 ballclubs with the highest contact rates at the season’s 20-week mark (August 15). It’s notable that these 10 teams are collectively 85 games above .500, while the 10 clubs with the worst CTs are a total of 112 games below the break-even mark.
The big-league average for CT, by the way, is .751 this season. The Seattle Mariners are the worst at .686.
1. San Diego Padres, CT .805
2. Kansas City Royals, CT .798
3. Houston Astros, CT .791
4. Cleveland Guardians, CT .780
5. Washington Nationals, CT .774
6. Arizona Diamondbacks, CT .773
6. Toronto Blue Jays, CT .773
8. Texas Rangers, CT .770
9. Minnesota Twins, CT .764
10. New York Yankees, CT .763
This has been a good year, so far, for the Cleveland Guardians, Milwaukee Brewers, and San Diego Padres. All three clubs have a good chance of making the playoffs.
That’s important because those three franchises are currently enduring baseball’s longest championship droughts.
The Guardians, then known as the Indians, most recently won a World Series in 1948. Their drought dates from the following year, 1949, through last season, 2023. That’s a title-less streak of 75 years and counting.
The Brewers and Padres have two characteristics in common. They were founded in 1969, and they have never won a world title. That puts their championship droughts at 55 seasons, as they enter 2024’s postseason.
Six franchises have gone at least 40 years without a World Series trophy. The year in parentheses is the one in which the drought began:
1. Cleveland Guardians (1949), 75 years
2. Milwaukee Brewers (1969), 55 years
2. San Diego Padres (1969), 55 years
4. Seattle Mariners (1977), 47 years
5. Pittsburgh Pirates (1980), 44 years
6. Baltimore Orioles (1984), 40 years
August 15 is the informal three-quarters mark of the season, four and a half months into the schedule, with only a month and a half to play.
It’s a good point to determine which teams are running hot as the stretch drive approaches — and which are cooling off.
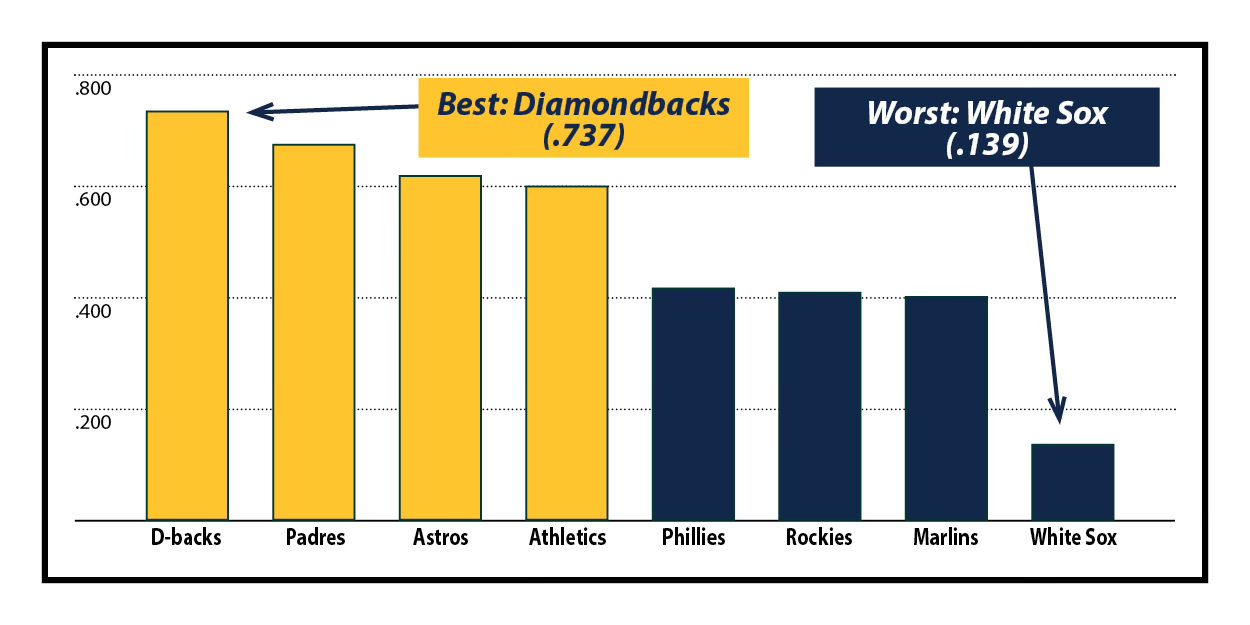
Today’s graph shows the four clubs that posted the best winning percentages between the start of July and the midpoint of August, led by the Diamondbacks. Arizona went 28-10 (.737) over that stretch of a month and a half, rocketing back into playoff contention.
If only the Chicago White Sox could say the same. The Sox played 5-31 ball from July 1 to August 15 for a truly miserable winning percentage of .139, easily the worst over that period.
The graph includes the four clubs with the best records from the halfway mark to the three-quarters pole, as well as the four worst. It’s notable that the allegedly hapless Oakland Athletics are among the four leaders, while the supposedly invincible Philadelphia Phillies are one of the tailenders.
A new installment will arrive in your email each Tuesday morning
We’re not only nearing the end of the 2024 season, but also the halfway point of the entire decade. The (nearly) five initial years of the 2020s have been far from normal, an inevitable outgrowth of the Covid-19 pandemic.
Yet things have settled down, giving us a chance to scrutinize the leaders in various statistical categories. Today’s quiz is focused on the top batters between 2020 and the midpoint of August 2024.
You can, as always, look to the bottom of this newsletter for the answers.
1. Who has hit the most home runs since the start of the 2020 season?
2. Which batter has accumulated the most hits in the half-decade?
3. Who has driven in the most runs over the most recent five seasons?
4. Which batter has drawn the most walks since 2020?
A. Aaron Judge
B. Matt Olson
C. Kyle Schwarber
D. Juan Soto
5. And who has suffered the most strikeouts over the (almost) five-year period?
Nobody would dispute that Manny Machado is one of today’s superstars — indeed, one of the greatest baseball players of recent times.
The third baseman for the San Diego Padres has also played for the Baltimore Orioles and Los Angeles Dodgers since his big-league debut in 2012. Machado has never won a Most Valuable Player Award, yet he is often in the conversation. He has finished among the top 10 vote-getters in five different MVP elections, most recently in 2022, when he placed second.
But there are a few flaws in Machado’s game, notably his tendency to hit into double plays. He has grounded into 174 DPs over the past 10 seasons (2015 to mid-August 2024), the highest total in the majors.
Here are the 10 batters with the most groundouts into double plays (GDP) in that span of (nearly) 10 years, according to Baseball Reference:
1. Manny Machado, GDP 174
2. Jose Abreu, GDP 173
3. Nolan Arenado, GDP 157
4. J.D. Martinez, GDP 152
5. DJ LeMahieu, GDP 146
6. Jose Altuve, GDP 133
7. Carlos Correa, GDP 132
8. Xander Bogaerts, GDP 130
8. Miguel Cabrera, GDP 130
10. Albert Pujols, GDP 129
The week of August 13-19 began poorly for the 1984 Detroit Tigers, who were destined to be ranked as the greatest ballclub of baseball’s Modern Era (1961 to the present).
Detroit lost both ends of a doubleheader to California on August 14, and the second game was a real blowout: Angels 12, Tigers 1. The two defeats cut the Tigers’ lead in the American League East to 7.5 games, the smallest it had been since the first half of July.
But the club quickly reverted to form, winning the final two games of its series with California, then two of three with the Seattle Mariners. The highest moment of drama occurred on August 16, when Barbaro Garbey doubled in the 12th inning for a 8-7 walk-off win over the Angels.
The Tigers held an 81-44 record (.648) on the morning of August 20, putting them 10 games ahead of the second-place Toronto Blue Jays.
The 1962 New York Mets would go down in history as the Modern Era’s losingest team. Their final record would be 40-120.
The week of August 13-19 helped to cement that legacy. The Mets played six games, and they lost all six. The combined score for the week: Opponents 47, Mets 20.
The biggest blowout occurred in the nightcap of an August 18 doubleheader. The St. Louis Cardinals rapped 13 hits and drew six walks from three New York pitchers, while future Hall of Famer Bob Gibson held the Mets to three hits. Final score: Cards 10, Mets 0.
The National League standings on August 20, 1962, showed New York in last place, of course. The Mets were 30-92 (.246) and sat 50.5 games — yes, 50.5 — behind the first-place Los Angeles Dodgers.
1-B. (No surprise here. Judge is the easy leader with 191 homers from 2020 to mid-August 2024. Ohtani is the runner-up at 169.)
2-A. (Freeman holds a comfortable lead with 788 hits. Turner is next in the rankings for the half-decade with 744.)
3-C. (It’s a tight race. Olson is on top with 457 RBIs since opening day in 2020, but Ramirez is on his heels with 455.)
4-D. (This one isn’t close. Soto has drawn 556 walks over the half-decade. Schwarber is a distant second with 394 walks.)
5-D. (Suarez is the whiff king with 780 strikeouts since 2020. Schwarber is next with 751.)
[ad_2]
Source link


